Welcome
Hi, I’m Mohan
An enthusiastic
Web Developer
Data Analyst
Python Developer
ready to bring fresh ideas and
creative solutions to your projects.

Hi, I’m Mohan
An enthusiastic
Web Developer
Data Analyst
Python Developer
ready to bring fresh ideas and
creative solutions to your projects.
A passionate Web Developer, Data Analyst, and Python Programmer with a strong foundation in computer science.
 GitHub
 MongoDB
 Excel
Excel
 SQL
SQL
 PowerPoint
 Canva
Canva
 WordPress
 Git
Git
 Windows
Hi, I'm Mohan, a passionate Web Developer, Data Analyst, and Python Programmer with a strong
foundation in computer science. I graduated with a B.Sc. in Computer Science from SRM University
(2024) and am continuously enhancing my technical expertise to stay ahead in the ever-evolving tech
landscape.
My skill set spans across web development, data analytics, and design. I have a strong command over
HTML, CSS, and JavaScript, enabling me to build structured, responsive, and interactive web
applications. I am also proficient in React.js, which allows me to create dynamic user interfaces.
Version control is a crucial part of my workflow, and I have extensive experience with Git and
GitHub for efficient collaboration and code management.
In the field of data analytics, I work with Python, particularly using Pandas for data manipulation
and analysis. I have a solid understanding of SQL for querying and managing relational databases,
along with experience in MongoDB for handling NoSQL databases. Additionally, I use Power BI and
Excel for data visualization, reporting, and business intelligence.
Beyond development and analytics, I also have experience in graphic design and presentation tools
like Photoshop, Canva, Figma, and PowerPoint, allowing me to create visually compelling designs and
reports.
Currently, I am deepening my expertise in data analytics and web development to bridge the gap
between technology and business solutions. My goal is to apply my skills to real-world projects,
build scalable applications, and drive impactful insights through data. I am always eager to
collaborate on innovative ideas and explore new challenges in the tech industry.
Let’s
connect and create something amazing together!
Look at My projects
With expertise in Python, JavaScript, and Data Analytics, I develop innovative solutions that streamline workflows and enhance decision-making. My strong analytical skills, combined with hands-on experience in web development and data-driven projects, enable me to build efficient and scalable applications. Passionate about solving real-world challenges, I focus on creating impactful solutions that bridge technology and practical needs.
 Hand Gesture Control for Mouse Interaction Using Python
A virtual mouse using hand gestures allows users to control a computer's cursor by tracking their hand movements.
This project allows users to control the mouse cursor and perform left/right clicks using hand gestures. It uses OpenCV for real-time video capture, MediaPipe for hand gesture recognition, and PyAutoGUI for mouse control. By recognizing specific hand gestures like "pinch" and "double-finger," the program simulates mouse actions.
GitHub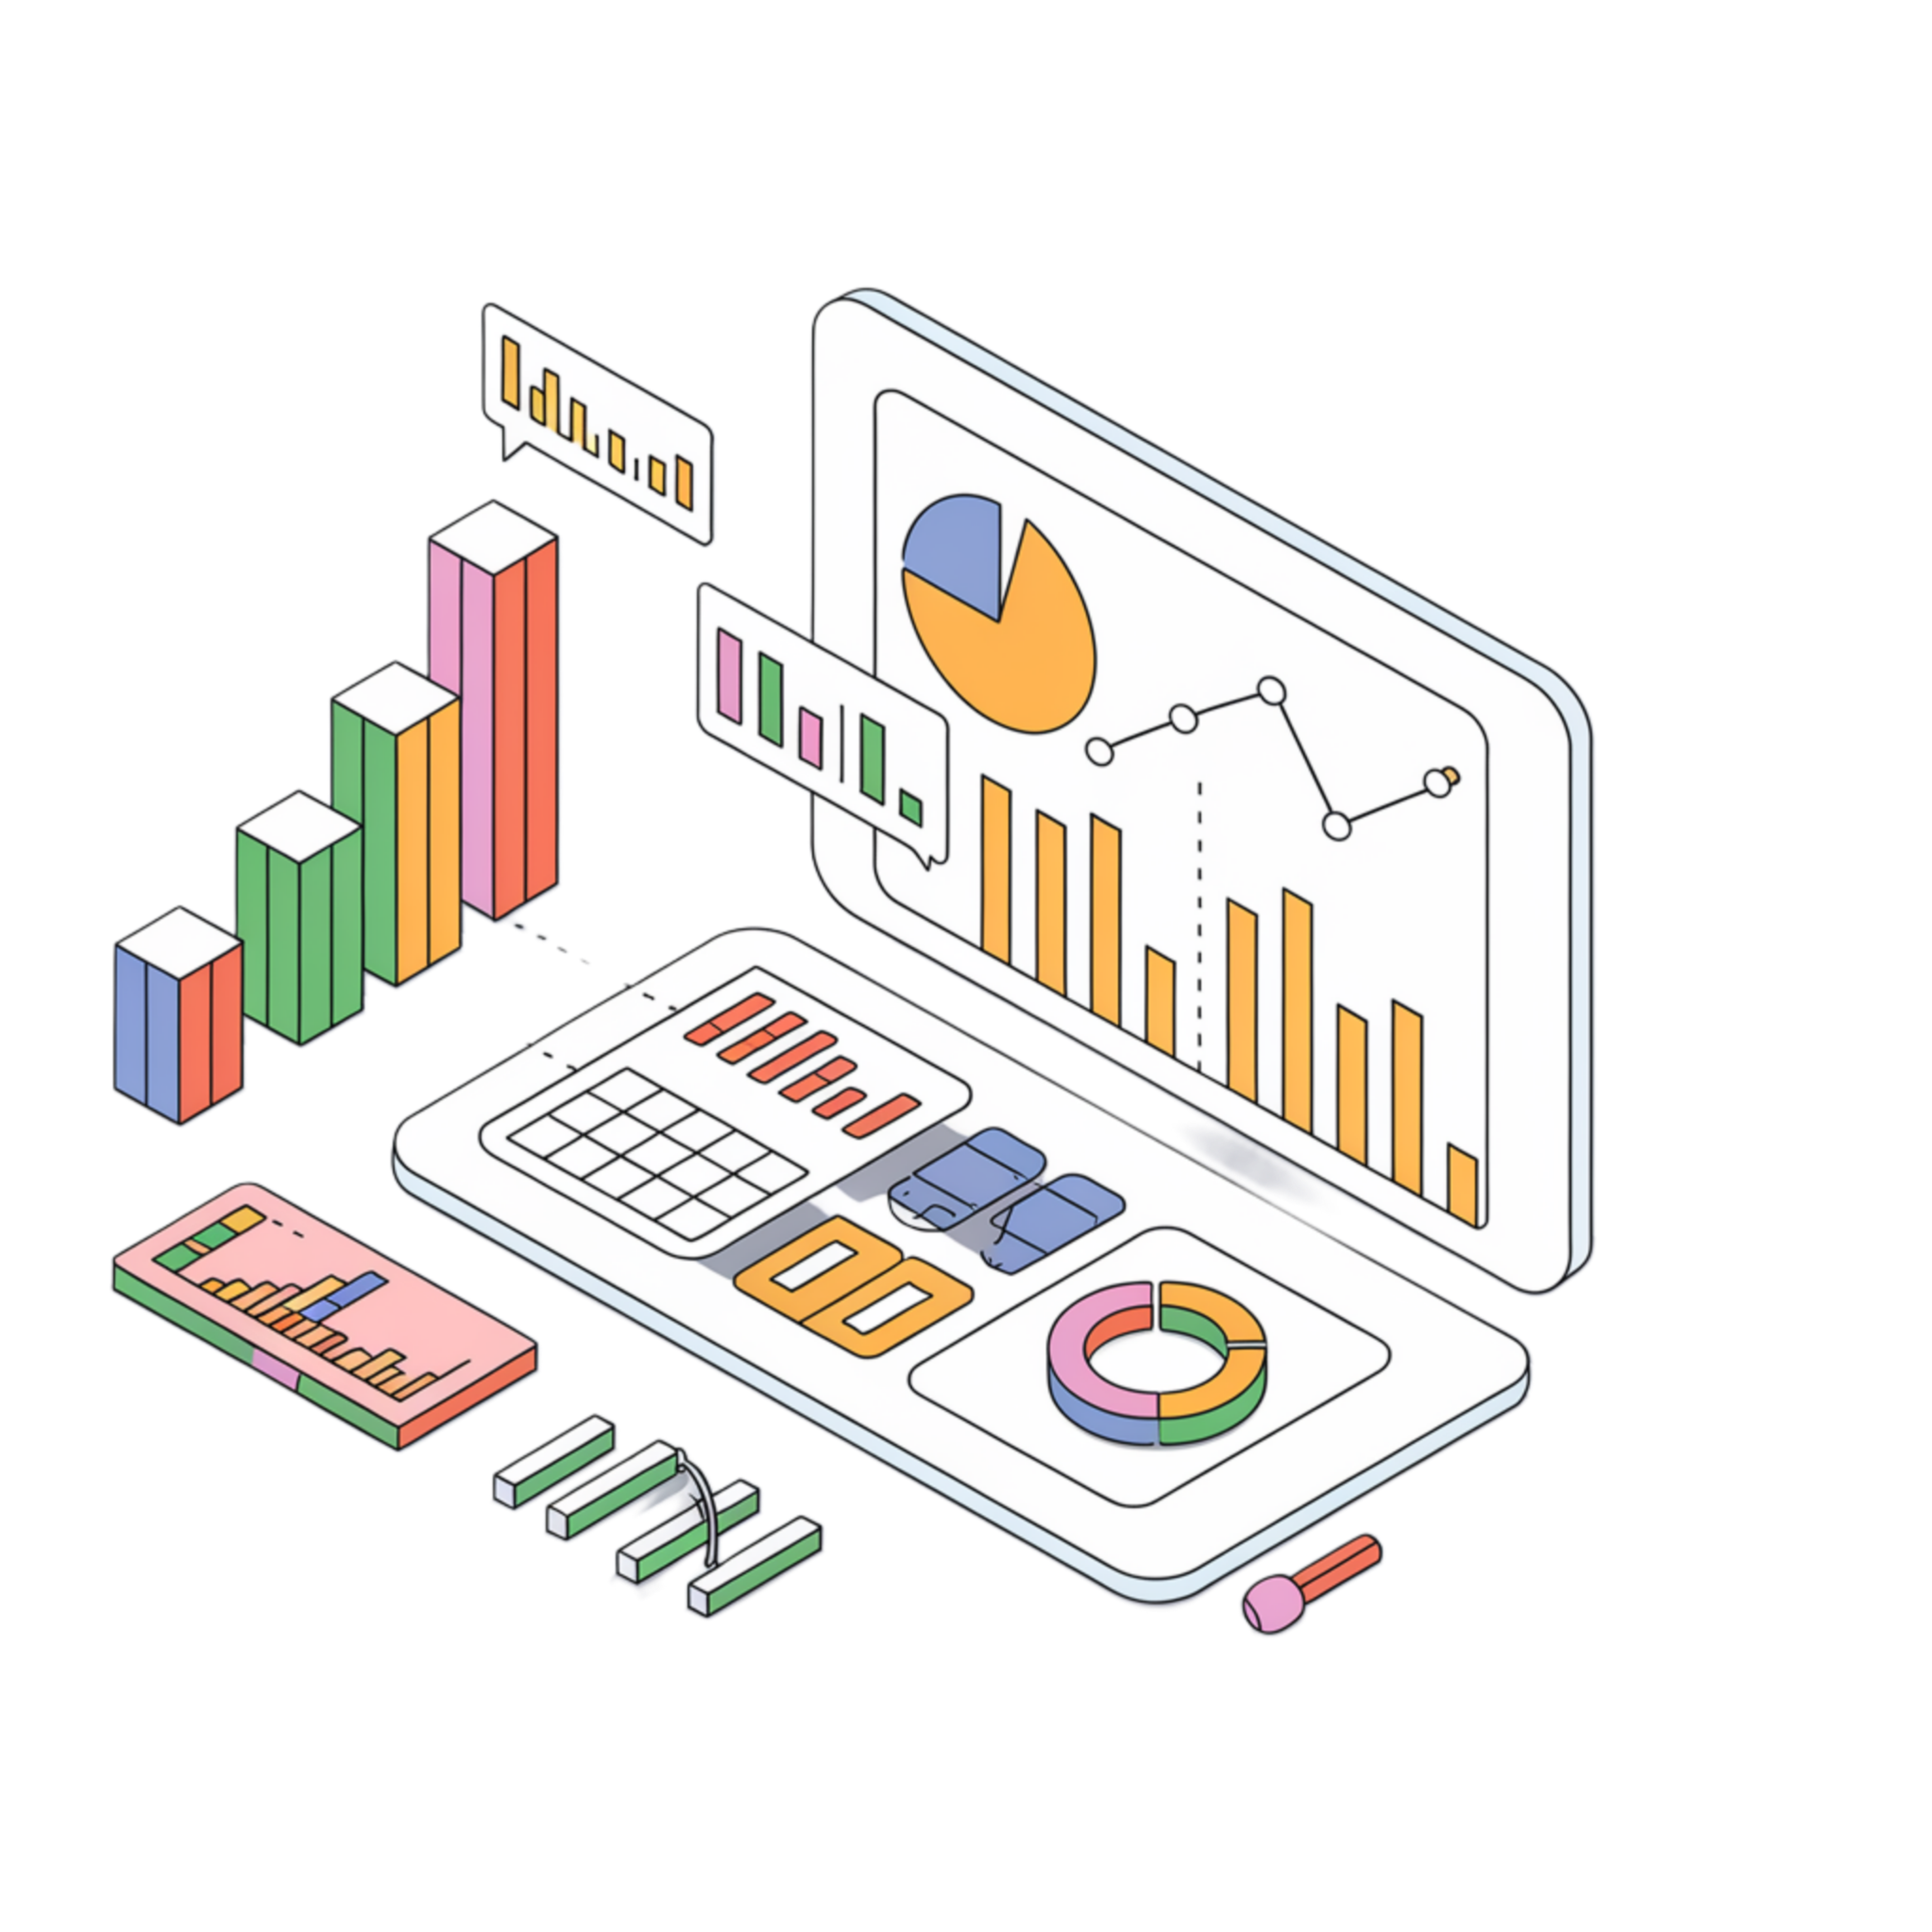 Automated Excel to Interactive Dashboard Using Pandas
Transform your Excel data into dynamic dashboards effortlessly with this Streamlit application.
This Streamlit application enables users to upload an Excel file, select a sheet, and visualize the data using interactive charts. It also provides summary statistics (e.g., sum, mean, and median) and supports various chart types like line charts, bar charts, pie charts, scatter plots, histograms, and box plots.
GitHub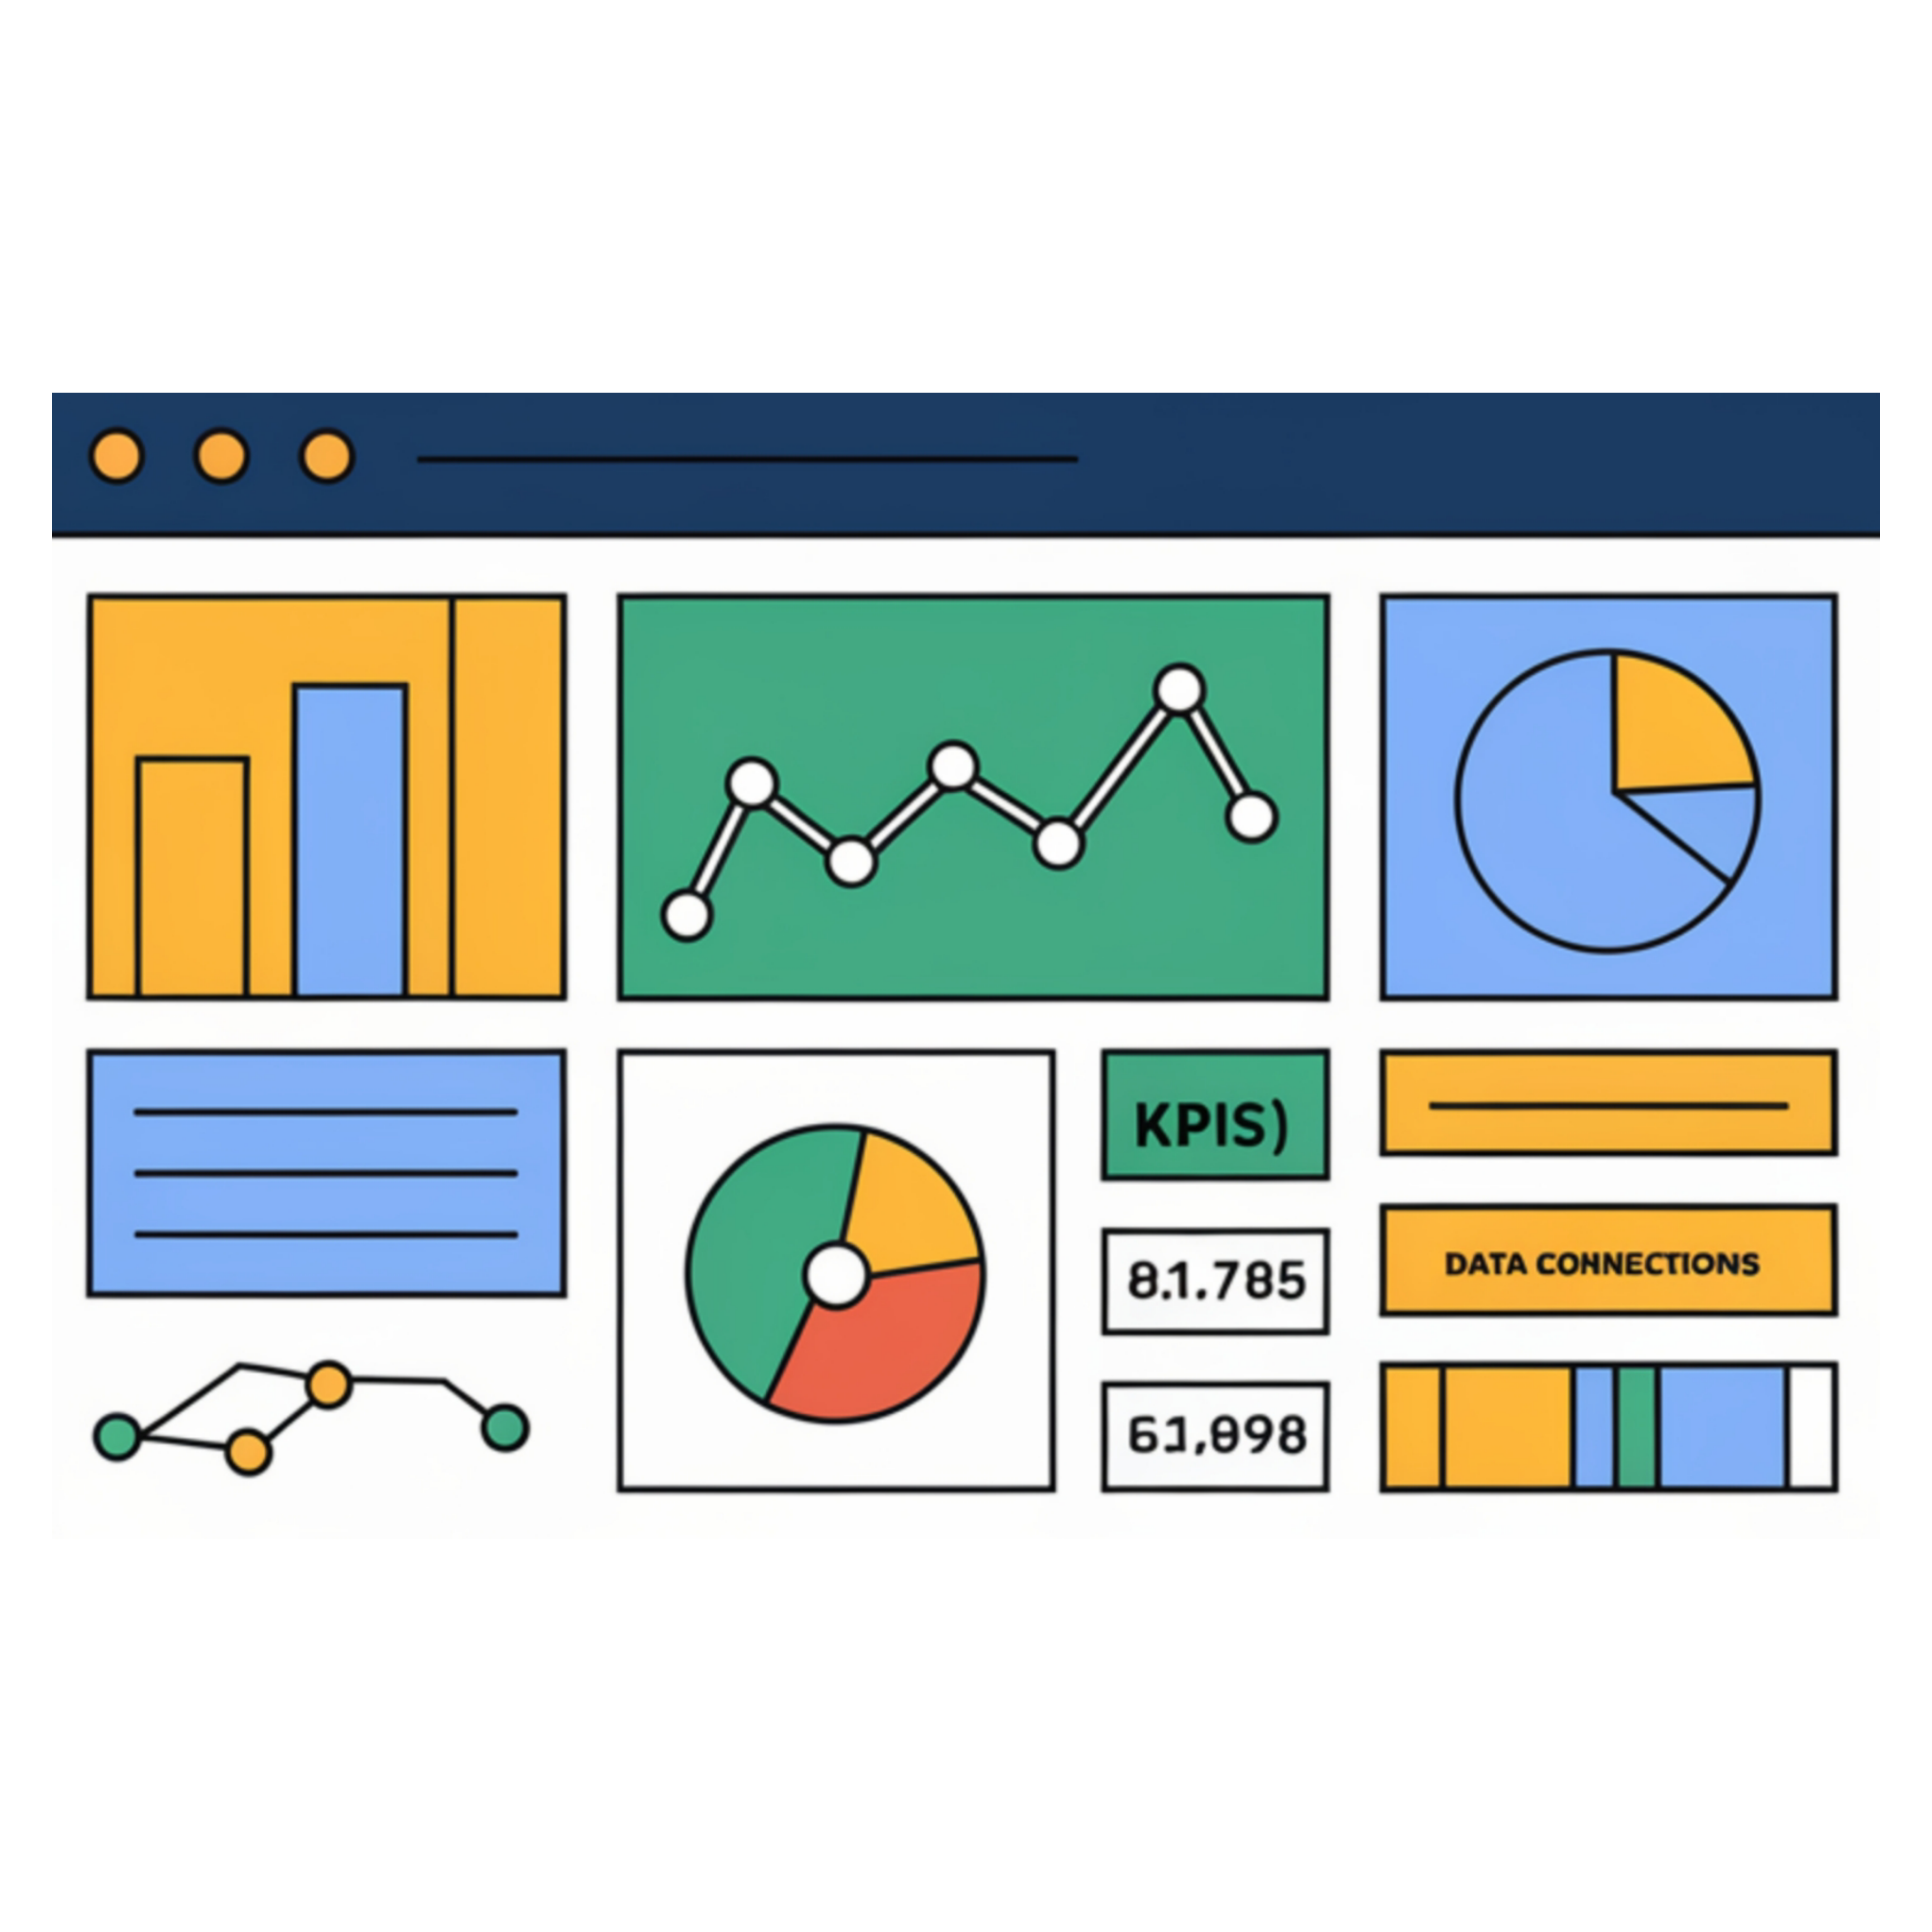 HR Analytics Dashboard Using PowerBi
Visualize employee data with clarity. This HR analytics dashboard empowers data-driven decisions.
This HR Analytics Dashboard provides a comprehensive view of critical employee data, enabling data-driven decisions for improved workforce management. Through interactive visualizations, key metrics like attrition rates, employee demographics, and job satisfaction are presented.
GitHub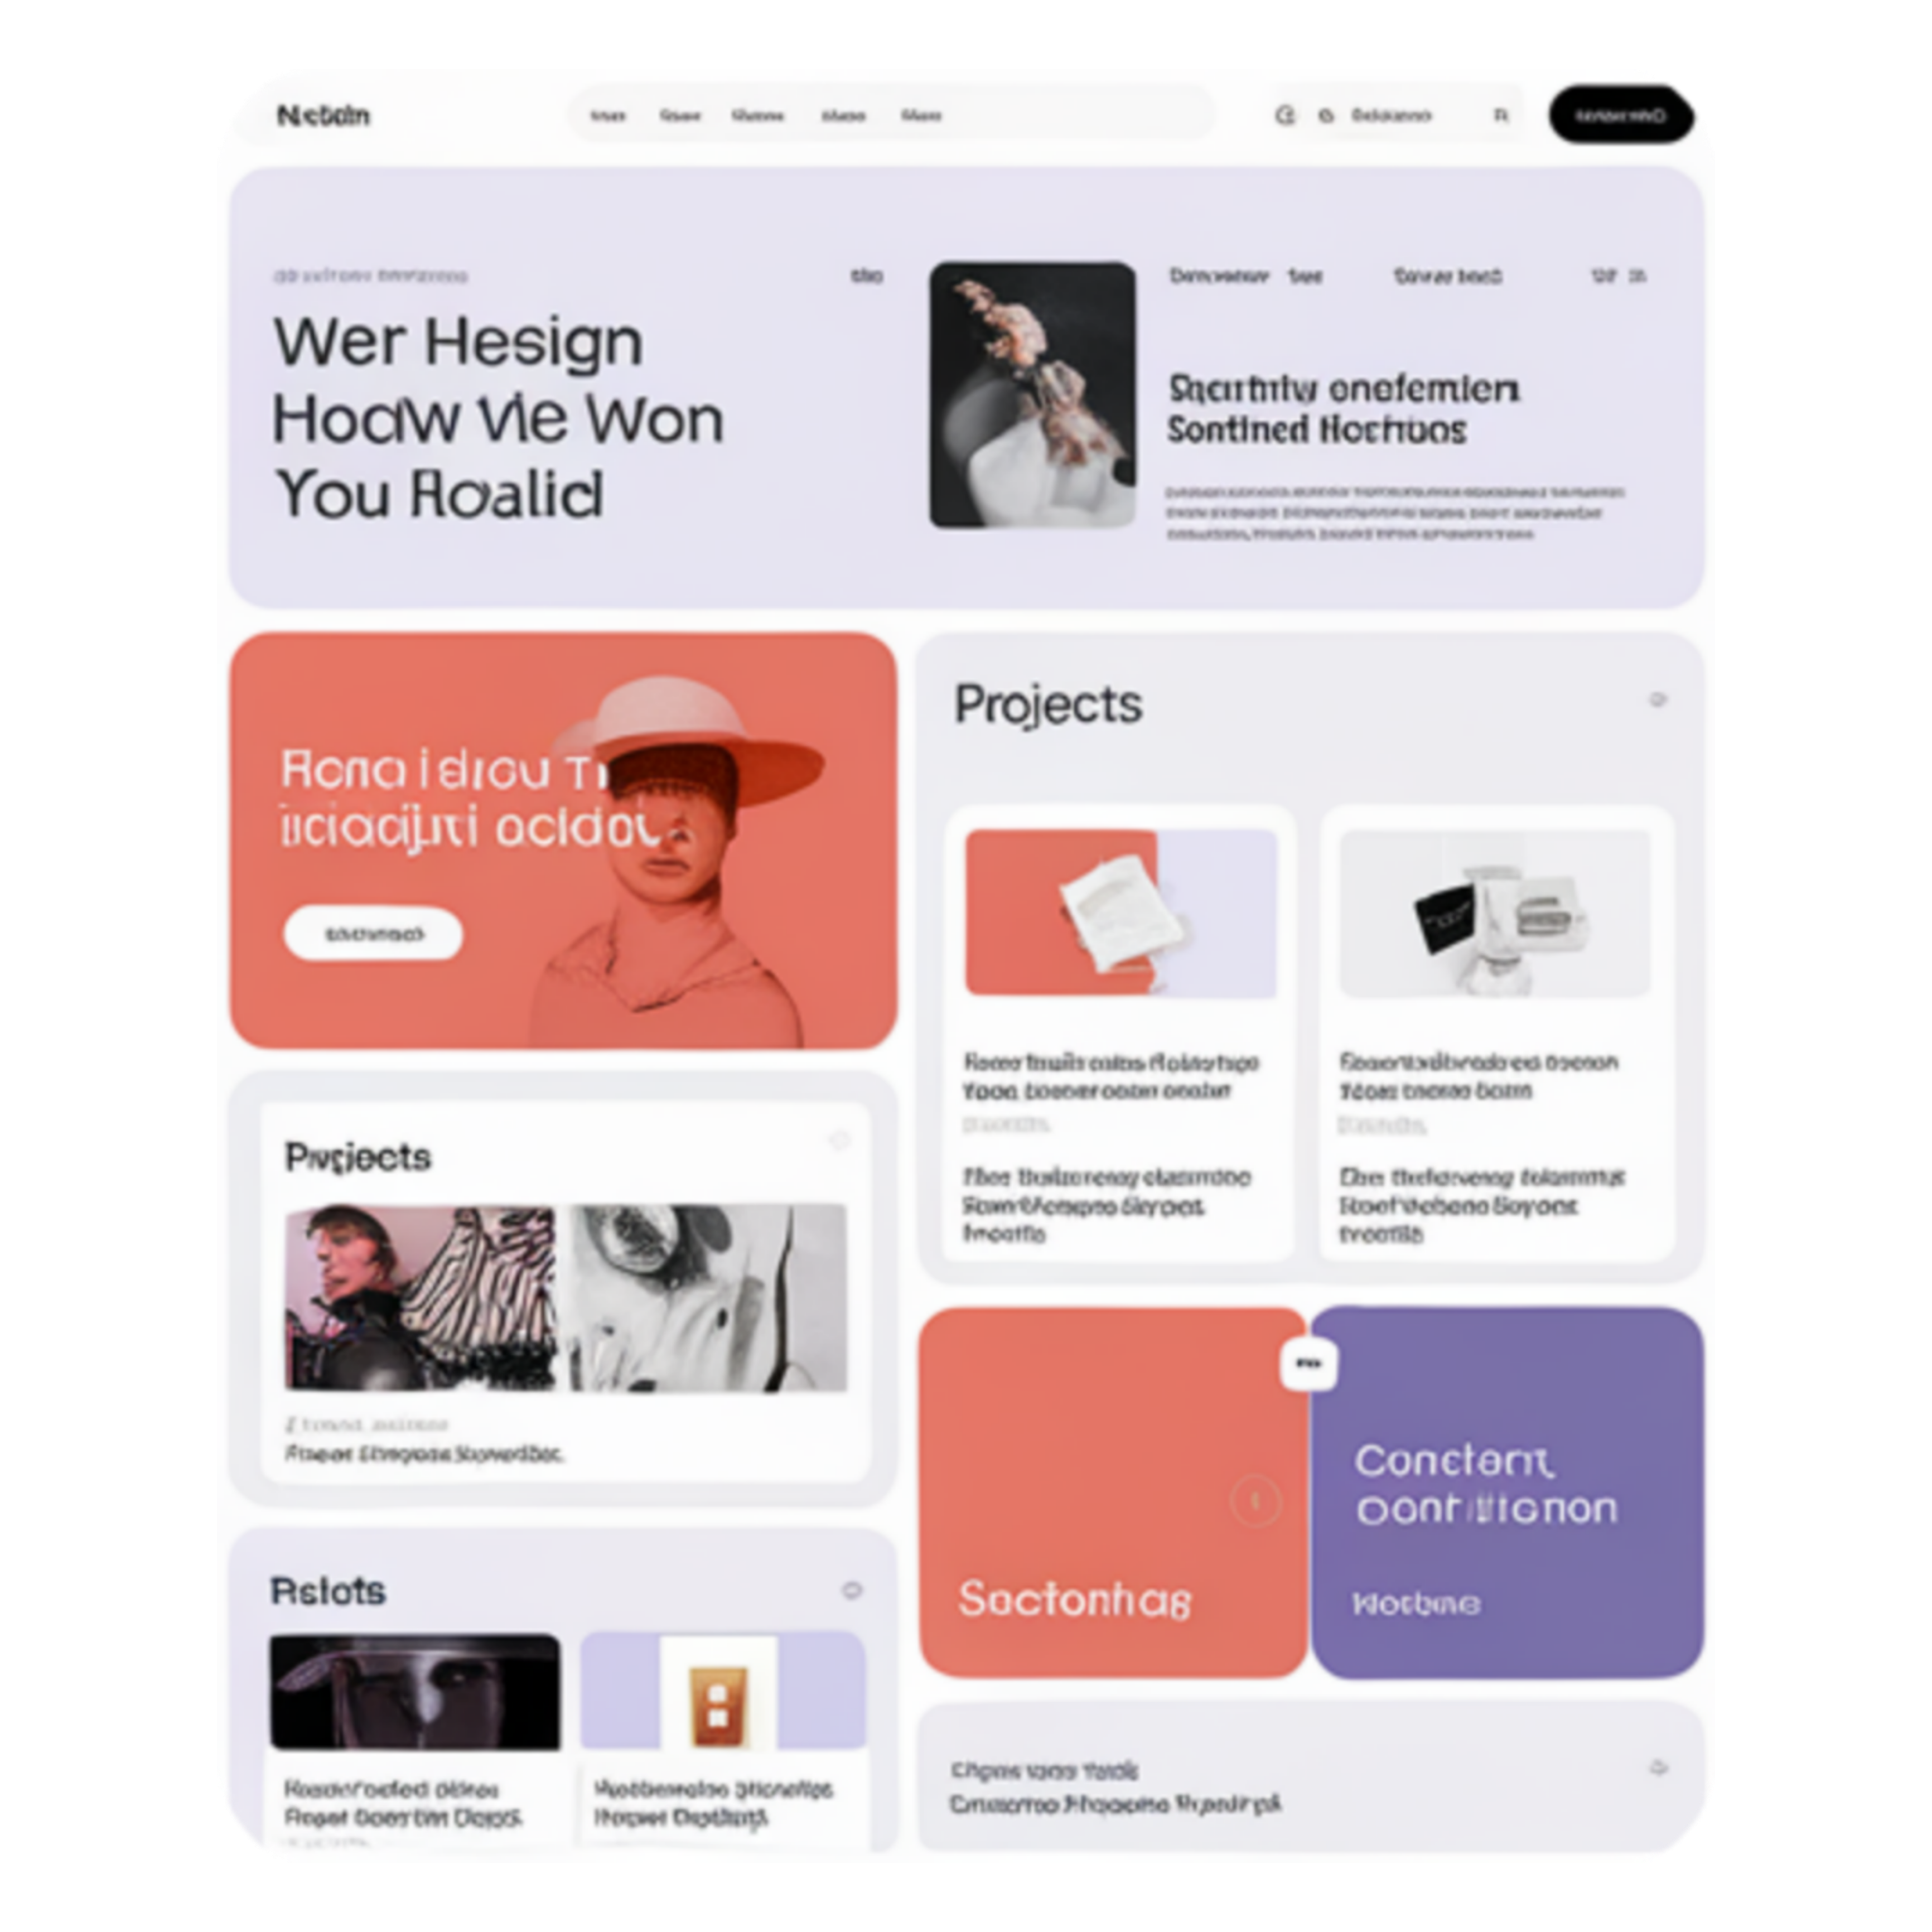 Responsive Portfolio Using HTML, CSS and JavaScript
Discover innovative solutions and creative designs. Explore our portfolio to see how we transform ideas into reality.
portfolio reflects a commitment to excellence and a dedication to crafting unique solutions for our clients. We specialize in blending creativity with technical proficiency to deliver projects that not only meet but exceed expectations.
GitHub
Hand Gesture Control for Mouse Interaction Using Python
A virtual mouse using hand gestures allows users to control a computer's cursor by tracking their hand movements.
This project allows users to control the mouse cursor and perform left/right clicks using hand gestures. It uses OpenCV for real-time video capture, MediaPipe for hand gesture recognition, and PyAutoGUI for mouse control. By recognizing specific hand gestures like "pinch" and "double-finger," the program simulates mouse actions.
GitHub
Automated Excel to Interactive Dashboard Using Pandas
Transform your Excel data into dynamic dashboards effortlessly with this Streamlit application.
This Streamlit application enables users to upload an Excel file, select a sheet, and visualize the data using interactive charts. It also provides summary statistics (e.g., sum, mean, and median) and supports various chart types like line charts, bar charts, pie charts, scatter plots, histograms, and box plots.
GitHub
HR Analytics Dashboard Using PowerBi
Visualize employee data with clarity. This HR analytics dashboard empowers data-driven decisions.
This HR Analytics Dashboard provides a comprehensive view of critical employee data, enabling data-driven decisions for improved workforce management. Through interactive visualizations, key metrics like attrition rates, employee demographics, and job satisfaction are presented.
GitHub
Responsive Portfolio Using HTML, CSS and JavaScript
Discover innovative solutions and creative designs. Explore our portfolio to see how we transform ideas into reality.
portfolio reflects a commitment to excellence and a dedication to crafting unique solutions for our clients. We specialize in blending creativity with technical proficiency to deliver projects that not only meet but exceed expectations.
GitHubI'am Open for any suggestion or just to have a chat
Address : 487, Baba Nagar, Sunnambukulam, Gummudipoondi, India 601 201
Phone : +91 9944703738
Email : mohancheenu04@gmail.com
Instagram : mohan_cheenu